Short answer: Once a week, at a set time, close out your journal, read a handful of numbers in R (risk units), compare the trades where you followed your checklist with the ones where you didn't, look at which setups and moods cost you, and choose one change for next week. Keep it to 30 to 45 minutes so it actually happens.
This week, a post by veteran trader Anthony Crudele drew more than 70,000 views on X. His point was that "somewhere along the way, the conversation shifted from building careers to chasing payouts", and the replies filled up with traders arguing about instant gratification, prop-firm incentives and what it takes to build a real skill. Whatever you think of prop firms, building that skill depends on an unglamorous habit: looking honestly at your own trades.
A journal only helps if you read it.
Here's a simple weekly routine.
What to log on every trade
The review is only as good as the entries. Log these while the trade is fresh:
- Instrument, direction, date and time.
- Planned risk and planned target, so you can express the result in R. One R is the amount you planned to lose if the stop was hit. A trade that made twice your planned risk is +2R; a full stop-out is −1R.
- Result in R and in money.
- Setup tag. Use a short, fixed list of names for your setups so they can be grouped later.
- Checklist followed: yes or no. Did you go through your pre-trade checklist and meet every item before entering?
- Emotion before entry. One word: calm, bored, impatient, frustrated, confident.
- Screenshots before entry and after exit, and a one-line note on what happened.
R matters because it makes trades comparable. A $200 loss means something different on a small account than on a large one; −1R always means "I lost what I planned to risk".
The weekly review, step by step
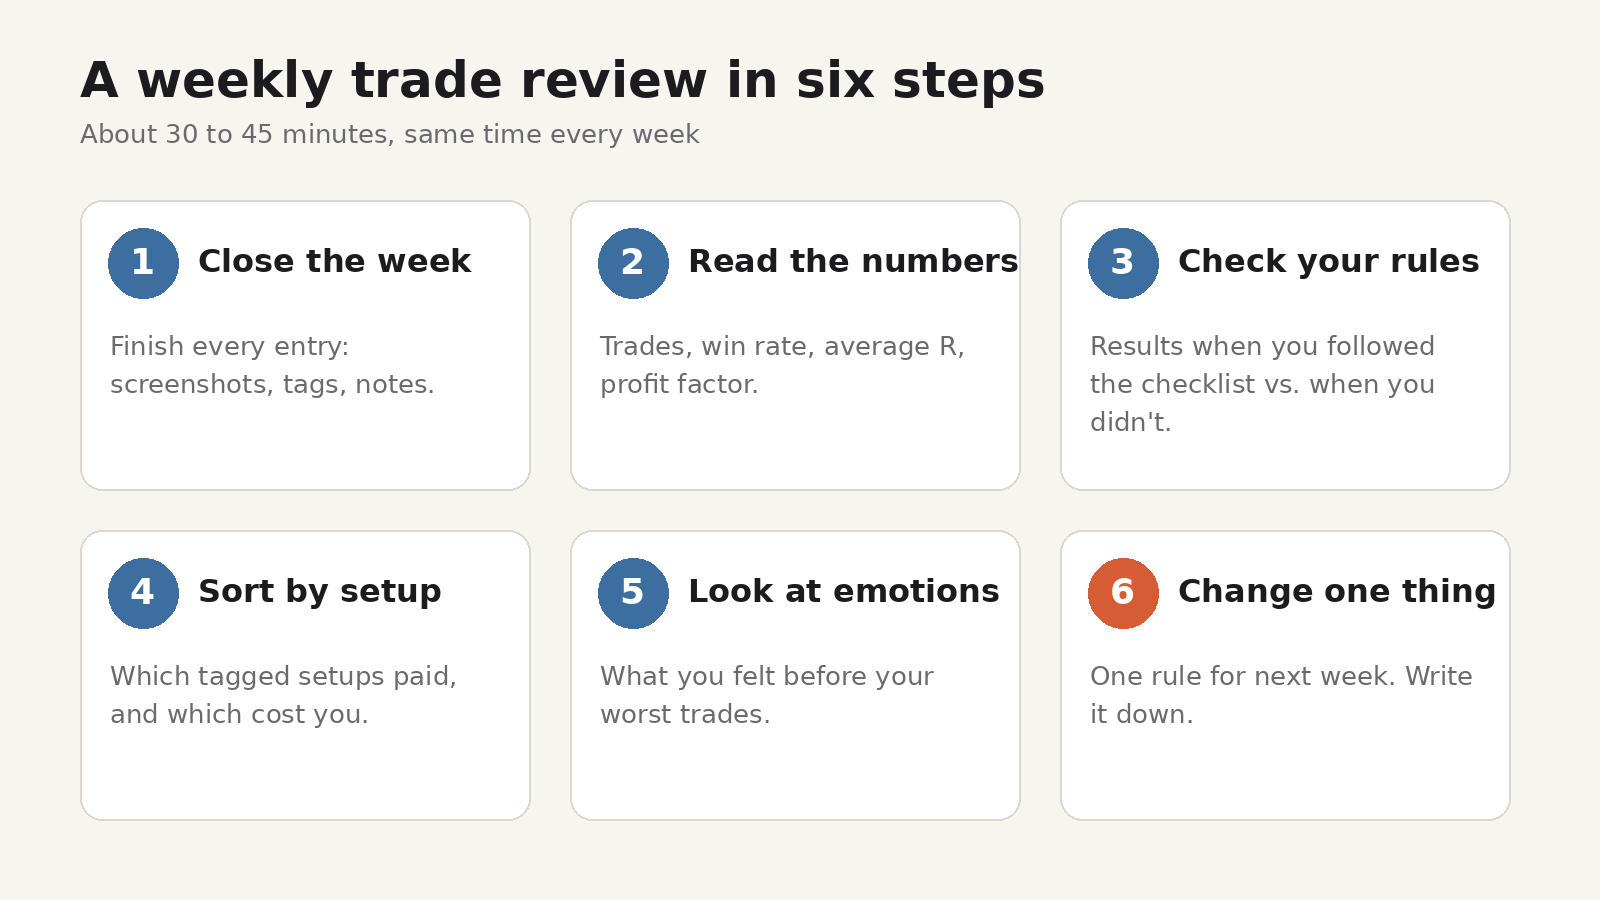
1. Close the week
Fill in anything missing: screenshots, tags, the checklist answer, the emotion. Don't review a half-empty journal. If a trade has no screenshot or note, add what you remember and mark it as incomplete.
2. Read the numbers
Keep it to a few figures, all in R:
- Number of trades. More than you planned? That alone is worth a note.
- Win rate: winners ÷ total trades.
- Average win and average loss in R.
- Profit factor: total won ÷ total lost. Above 1 means winners outweighed losers for the period.
- Net result in R, and per trade (net R ÷ number of trades).
Then stop. A single week is far too few trades to tell you whether a strategy works. The numbers are there to notice changes and outliers, not to judge your system.
3. Check your rules
This is the most useful step. Split the week's trades into two groups: checklist followed and checklist skipped. Add up the R for each.
If the skipped group keeps losing week after week, the problem isn't the strategy, it's the trades you take outside it. That's good news, because it's the easiest thing to change.
4. Sort by setup
Group trades by setup tag and add up R for each. Look for the setup you took most often and the one that cost the most. Again, one week is a small sample, so keep a running tally and only act on patterns that last several weeks.
5. Look at emotions
Read the emotion you logged before your three worst trades. If "impatient" or "frustrated" keeps showing up, that's a cue for a rule, such as a pause after a loss or a cap on trades per day.
6. Change one thing
Pick a single change for next week and write it at the top of the next week's journal. "Only take setup A before noon." "No new trade within 30 minutes of a loss." "Skip the trade if any checklist item is a no." One change is easy to test. Five at once and you won't know which one mattered.
A worked example
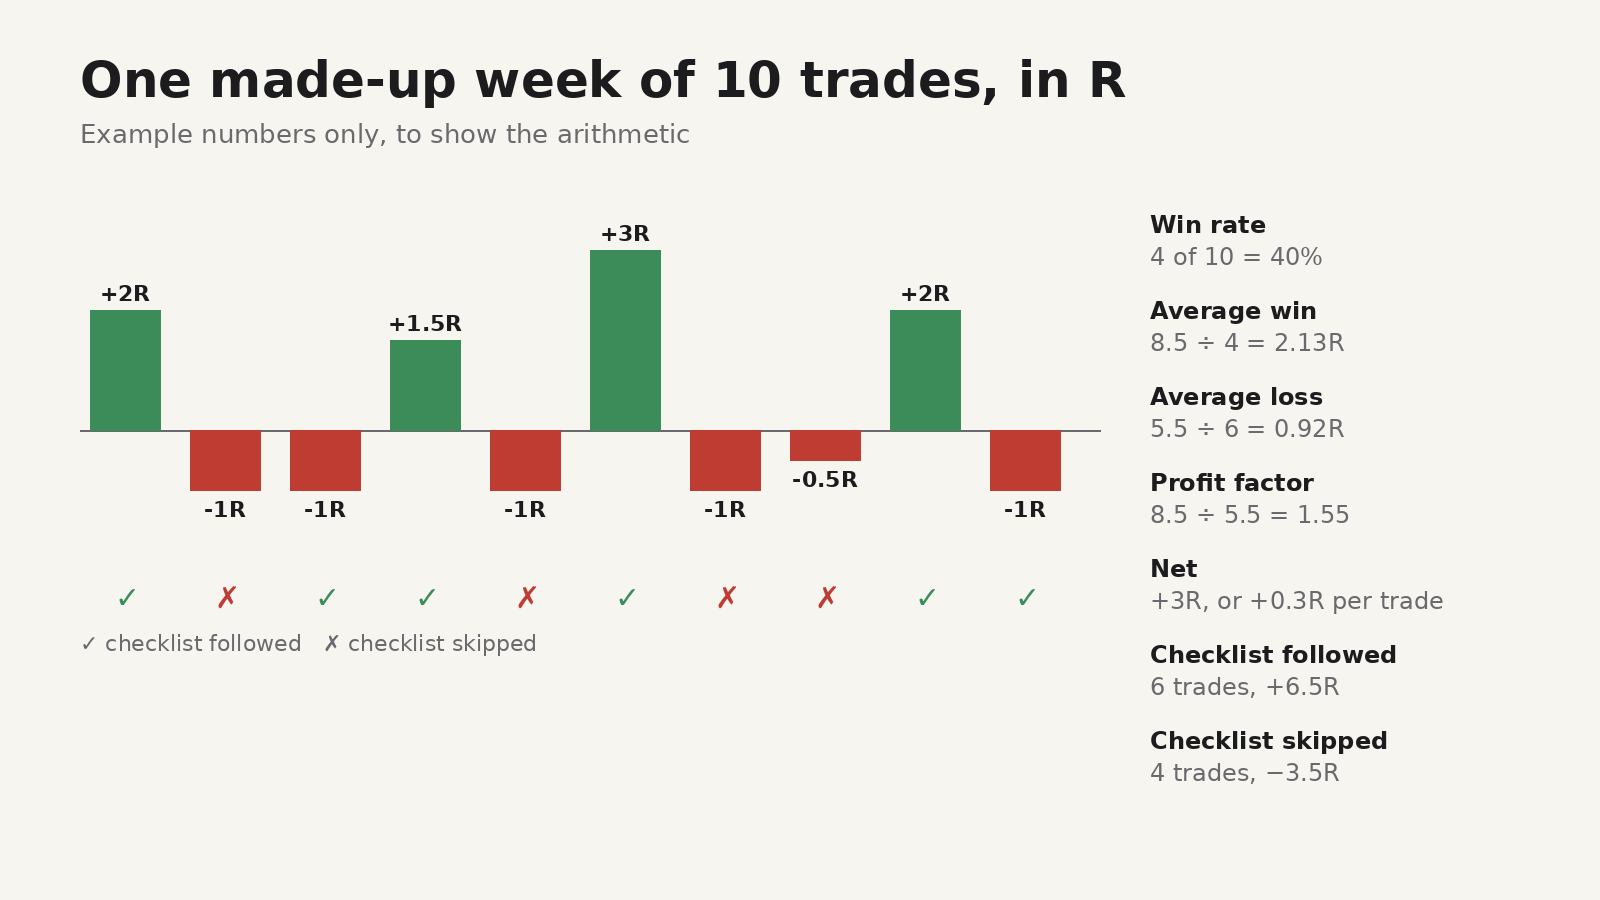
The numbers below are made up to show the arithmetic. They aren't results from any real account.
Ten trades in a week, in R: +2, −1, −1, +1.5, −1, +3, −1, −0.5, +2, −1.
- Win rate: 4 winners out of 10 = 40%.
- Total won: 2 + 1.5 + 3 + 2 = 8.5R, so the average win is 8.5 ÷ 4 ≈ 2.13R.
- Total lost: 1 + 1 + 1 + 1 + 0.5 + 1 = 5.5R, so the average loss is 5.5 ÷ 6 ≈ 0.92R.
- Profit factor: 8.5 ÷ 5.5 ≈ 1.55.
- Net: 8.5 − 5.5 = +3R, or +0.3R per trade.
Now the rule check. In this example the checklist was followed on six trades (+2, −1, +1.5, +3, +2, −1 = +6.5R) and skipped on four (−1, −1, −1, −0.5 = −3.5R). The week was positive overall, but every skipped-checklist trade lost. The one change for next week writes itself: no entry unless the checklist is complete.
Notice what the example doesn't prove. Four trades is nowhere near enough to say the skipped trades will always lose. It's a reason to keep tracking, not a conclusion.
Common mistakes in a weekly review
- Reviewing only the losers. Winners taken outside your rules are lucky, not good. Review them too.
- Changing the strategy every week. Small samples swing a lot. Change behaviour first, the strategy only after many weeks of data.
- Logging in money only. Money results hide whether you sized consistently. Use R.
- Skipping the review after a good week. Good weeks are when bad habits sneak in unnoticed.
- Making it too long. A two-hour review gets skipped. Thirty focused minutes every week beats a long one once a month.
Keeping the journal inside TradingView with TradeDesk
TradeDesk is a browser extension for Chrome and Firefox, made by UnifyBrowse, that adds a sidebar to TradingView with a risk calculator, a pre-trade checklist and a trading journal. On the Free plan:
- Trading journal: log trades with before, during and after screenshots, tags, emotions and notes. The Free plan holds up to 100 trades.
- Editable pre-trade checklist to go through before each entry.
- Basic statistics: trade count, win rate, P&L, profit factor, average R and an equity curve.
- Search and filter the journal by result, tag or keyword, which makes the setup and rule checks above quicker.
- Discipline guardrails: a daily loss limit and a post-loss cooldown.
- Full CSV and JSON export and import, if you'd rather do the review in a spreadsheet.
Your data is stored locally on your device. Pro removes the journal cap and adds advanced analytics, including breakdowns by market session, time of day, weekday, setup, symbol and emotion, a checklist-discipline report, and a calendar heatmap with win and loss streaks. See TradeDesk pricing for details.
TradeDesk is a planning and journaling tool, not financial advice. Trading involves risk of loss.
FAQ
How long should a weekly trade review take?
About 30 to 45 minutes is enough for most people. The point is to do it every week, not to make it exhaustive.
What is R in trading?
R is the amount you planned to risk on a trade. Results in R (for example +2R or −1R) let you compare trades of different sizes.
What is a good profit factor?
Above 1 means winners outweighed losers over the period. One week is too short to judge; look at it over many weeks.
Should I review every trade or only the bad ones?
Every trade. Winners taken outside your rules teach as much as losers.
Do I need special software for a trading journal?
No. A spreadsheet works. A journal inside your charting tool can make logging faster, which makes it more likely you'll keep it up.