Short answer: Bitcoin fell below $57,000 late on Friday 20 November (US time) and kept falling into Saturday, its lowest level since September 2024. If you're thinking about buying, the price you pay matters less than two things you can decide right now: where the trade is wrong, and how much money you're willing to lose if it is. Size the position from those two numbers, count every planned add-on as part of one position, and skip leverage unless you've already worked out your liquidation price.

What happened
According to CoinDesk, bitcoin sank below $57,000 on Friday, its lowest level since September 2024. That extends a bear market that began after the October 2025 peak above $126,000 and brings the quarterly decline to 28%. CoinGecko lists the all-time high as $126,080 on 6 October 2025. At 06:33 UTC on 21 November, CoinGecko showed bitcoin at about $56,100, roughly 55% below that high, after a 24-hour range of about $55,600 to $62,200.
The drop also took out an important level. Bitcoin's low over the summer was near $57,700, and the August–September rebound was built on it. Breaking that low is why so many charts were redrawn after the fall.
It wasn't only crypto. CoinDesk reports that tech stocks, gold, copper and Asian equities fell too, with the Nasdaq down more than 4% on Friday. Analysts it quotes point to rising inflation-adjusted Treasury yields and a more hawkish Federal Reserve outlook.
Leverage made the move worse. CoinGlass data cited by CoinDesk show $2.40 billion of crypto futures positions liquidated over 24 hours, more than $1 billion of it in bitcoin futures and $545 million in ether. The largest single liquidation was a $51.71 million long bet on bitcoin. When leveraged buyers get closed out, their forced selling pushes the price lower, which liquidates the next layer of buyers.
Why "buying the dip" goes wrong
Nobody knows whether $56,000 is a bargain or a stop on the way down, and this article won't guess. What we can say is that most dip-buying losses come from the plan, not the entry price:
- No exit point. "I'll hold until it comes back" works until the drawdown is bigger than you can stand, and then you sell at the worst moment.
- Size picked by feel. Buying "a bit" in a 7% daily move can still be a big loss in money terms.
- Adding without counting. Each new buy looks small on its own. Together they can risk several times what you meant to.
- Leverage. A leveraged long in a falling market gets liquidated before your thesis has time to play out. Our guide to liquidation price shows how fast that happens.
Step 1: Decide where you're wrong
Before you look at how much to buy, pick the price at which your reason for buying no longer holds. For a dip-buy, that's usually a level below a recent low that you think should hold. This is your stop. If you can't name one, you don't have a trade yet, only a hope.
Step 2: Decide what a loss is allowed to cost
Pick a fixed share of your trading account that you're willing to lose on this one idea. Many traders use 0.5% to 2%. The examples below use 1% of a $10,000 account, so the risk budget is $100.
Step 3: Size the position from the stop
Position size = risk budget ÷ distance from entry to stop.
Say you buy at $56,000 with a stop at $52,000. The distance is $4,000 per bitcoin, so the position is $100 ÷ $4,000 = 0.025 BTC, about $1,400 worth. If the stop is hit, you lose about $100 before fees and slippage. If you'd rather use a tighter stop, the position gets bigger. With a wider stop it gets smaller. The risk in money stays the same.
These numbers are an illustration, not a forecast or a recommended level.
Step 4: If you scale in, size the whole plan first
Scaling in (buying in several pieces as the price falls) is a popular way to buy a dip. The trap is sizing each piece on its own.
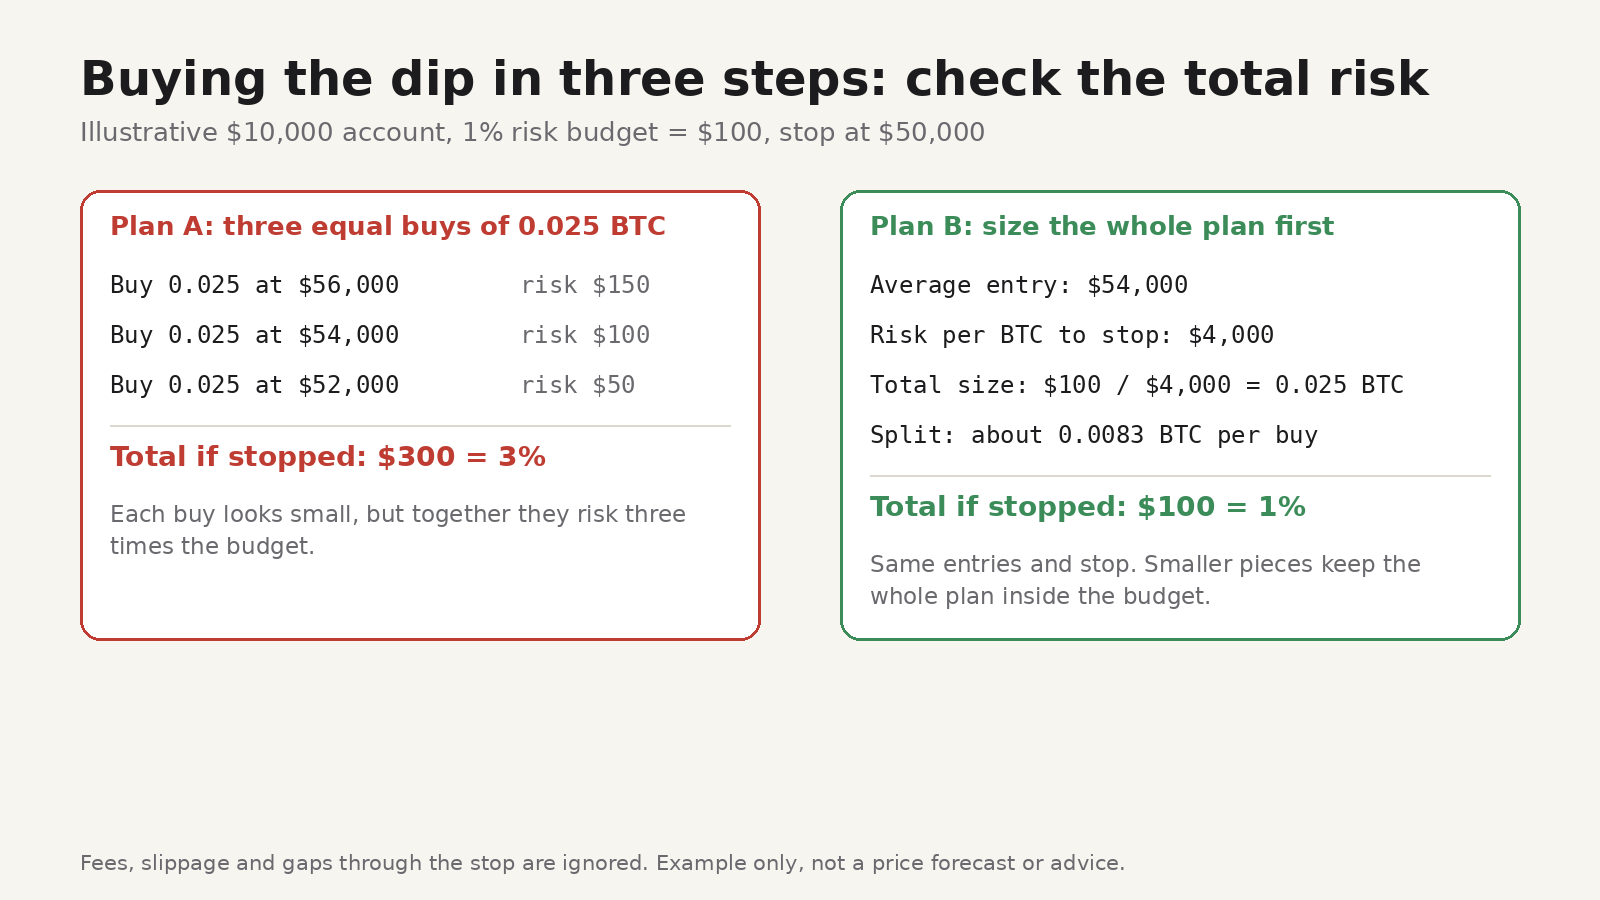
In the example above, three buys of 0.025 BTC at $56,000, $54,000 and $52,000 with a stop at $50,000 lose $150 + $100 + $50 = $300 if the stop is hit. That's 3% of the account, three times the budget, even though each buy looked like a "1% trade".
The fix is to plan the full position. With all three buys filled, the average entry is $54,000 and the distance to the stop is $4,000 per bitcoin. $100 ÷ $4,000 = 0.025 BTC in total, or about 0.0083 BTC per buy. Same entries, same stop, one third of the risk. If only the first piece fills and the price turns up, you hold a smaller position. That's the price of keeping the worst case fixed.
Step 5: Put limits on the day, not only the trade
Days like this one produce a lot of trades nobody planned. A daily loss limit, the most you'll lose across all trades in a day before you stop, keeps one bad session from becoming a bad month. A short cooldown after a loss helps with the urge to win it straight back. We cover both in daily loss limits for traders.
Step 6: Write it down before you click
A one-line note per trade is enough: why you're buying, where the stop is, what size, and how you feel. Read those notes back at the end of the week. You'll learn more from your own record of this selloff than from anyone's prediction about it. Our weekly trading journal review has a simple routine for this.
Doing this in TradeDesk
TradeDesk is our extension for Chrome and Firefox that adds a collapsible sidebar to TradingView. According to its product page, the free plan includes:
- Risk calculator for stocks, forex, crypto, futures and CFDs, with the risk-to-reward ratio shown live as you set entry, stop and target.
- Editable pre-trade checklist. You could add lines like "Stop placed below the level that invalidates the idea" and "Total size of all planned buys checked against my risk budget".
- Discipline guardrails: a daily loss limit and a post-loss cooldown.
- Trading journal with before, during and after screenshots, tags, emotions and notes, plus basic statistics such as win rate, average R and an equity curve.
Your data is stored locally on your device. Pro lifts the free plan's journal cap and adds advanced analytics and an economic calendar; see TradeDesk pricing.
TradeDesk is a planning and journaling tool, not financial advice. Trading involves risk of loss.
FAQ
Is this the bottom?
Nobody can tell you that, including us. Some analysts watch the next support area, others see the break of the summer low as a sign of further weakness. A plan that works only if you've called the bottom correctly isn't a risk plan.
What if I'm buying to hold for years, not trading?
Then the stop-loss maths matters less, but the size question doesn't go away. Buy only what you could hold through a further fall without being forced to sell, keep it unleveraged, and consider spreading purchases over time instead of all at once.
Should I use leverage to buy the dip?
Leverage shortens the distance to your liquidation price, and in this selloff more than $2 billion of positions were closed out in a day. If you do use it, work out your liquidation price first and make sure your stop sits well before it.
What about the Crypto Fear & Greed Index?
It measures market mood, not value. Extreme fear has come before both rebounds and further falls. Our explainer on the Crypto Fear & Greed Index covers what it measures and how to use it without letting it trade for you.