Short answer: The Crypto Fear & Greed Index is a daily score from 0 to 100 that summarises how fearful or greedy the Bitcoin market looks, built mostly from volatility and momentum. It read 10, deep in "Extreme Fear", on 15 and 16 November 2026 and 11 on 18 November. A low reading describes how rough the last few weeks have been. It isn't a reliable buy signal on its own, and past readings of 10 were followed by both big rallies and further drops. Its best use is as a check on your own behaviour, not as a trigger.
Where the index stands now
The index is published by Alternative.me. Its daily values for the past six weeks show how quickly sentiment turned:
- 22 October: 68 (Greed)
- 5 November: 50 (Neutral)
- 12 November: 28 (Fear)
- 15 and 16 November: 10 (Extreme Fear)
- 17 November: 12
- 18 November: 11
That's a fall of 58 points in 25 days, from 68 to 10. The drop came as Bitcoin slid. BlockchainReporter, citing CoinGecko, put Bitcoin at $64,780 shortly before 05:00 UTC on 16 November, 48.6% below its October 2025 record and 13.5% lower than a week earlier.

What goes into the number
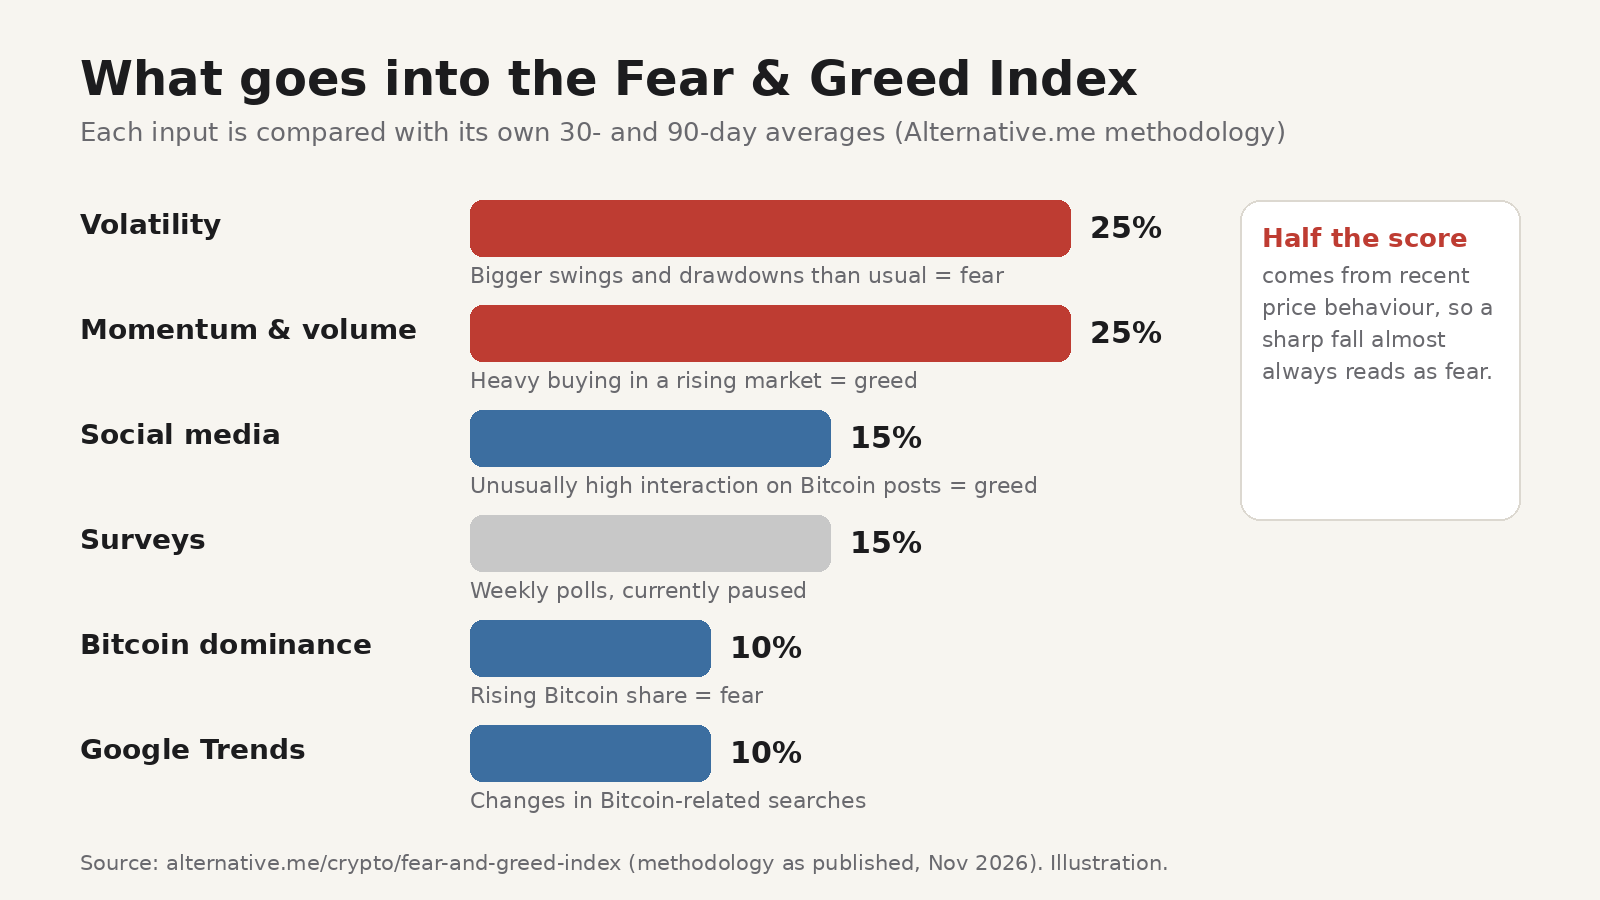
Alternative.me lists the inputs and their weights on its methodology page:
- Volatility (25%): current volatility and maximum drawdowns of Bitcoin, compared with the averages of the last 30 and 90 days. An unusual rise in volatility counts as fear.
- Market momentum and volume (25%): current volume and momentum against the same averages. High buying volume in a rising market counts as greed.
- Social media (15%): how fast and how much posts on Bitcoin hashtags are interacted with. Unusually high interaction counts as greed.
- Surveys (15%): weekly polls, currently listed as paused.
- Bitcoin dominance (10%): Bitcoin's share of the total crypto market. A rising share is read as fear, because money is moving away from more speculative coins.
- Google Trends (10%): changes in search volume for Bitcoin-related queries.
Two things follow from that list. First, half the score comes directly from recent price behaviour, so the index will almost always read "fear" during a sharp fall and "greed" during a strong rally. Second, every input is compared with the last 30 to 90 days. The score is relative: a fast drop from $95,000 and a fast drop from $6,000 can both print 10.
What past readings of 10 actually did
"Be greedy when others are fearful" is the usual line, and Alternative.me itself says extreme fear "can be a sign that investors are too worried" and "could be a buying opportunity". The data is less tidy than the slogan. Two independent looks at the history, both published this week, are worth reading side by side:
- CoinJuice found the index hit exactly 10 on 29 days since 2018. Across the 27 readings old enough to measure, Bitcoin's median return three months later was −3.0%, and it was higher in 13 of 27 cases. When only the first 10 of each fearful episode was counted, Bitcoin was higher three months later in 7 of 9 episodes.
- BlockchainReporter grouped every session at or below 10 into 26 clusters. Of the 25 old enough to measure, 14 ended higher 90 days later, with a median move of +1.4% and outcomes ranging from a 38.4% loss to a 100% gain.
Read together, that's close to a coin flip with a very wide spread. Some extreme-fear readings marked major lows. Others came early in a slide that kept going for weeks, as in May and June 2022. The sample is small, and the index can't tell you in advance which kind of reading you're looking at.
How to use it without letting it trade for you
The index is most useful as a mirror. It tells you what the crowd is feeling, which is often what you're feeling too. A few practical ways to use it:
1. Treat it as context, not an entry signal
A reading of 10 can sit next to a falling price for weeks. If your plan says "buy when the index is at 20 or below", you'd have been buying on 13 November and every day since. Use your own setup for entries and exits, and let the index tell you what kind of market you're in.
2. Expect bigger swings when the score is extreme
Because volatility is a quarter of the score, a very low reading usually means price is moving more than usual. That matters for position size. If your stop needs to be wider to survive normal swings, the position should be smaller so the amount you can lose stays the same. Position size = amount you're willing to lose ÷ distance from entry to stop.
3. Watch your leverage
Fast markets are where liquidations cluster. CoinGlass data cited by The Block showed $2.02 billion in crypto liquidations in 24 hours around the 15 November low. If you trade with leverage, check that your liquidation price sits well beyond your stop. We explain how in liquidation price explained.
4. Decide your rules before you look at the score
Fear and greed are contagious. Write down your maximum risk per trade and your daily loss limit before the session, then stick to them whatever the index says. A daily loss limit is one of the simplest guardrails against revenge trading on a red day.
5. Record it in your journal
Note the index value next to each trade, along with how you felt when you entered. After a few weeks, compare your results in fearful and greedy markets. Many traders find their worst trades cluster at one extreme. That's far more useful to you than the market-wide history above, because it's about your own behaviour. A weekly journal review is a good time to look.
Doing this in TradeDesk
TradeDesk is our extension that adds a collapsible sidebar to TradingView for Chrome and Firefox. Several of the habits above are built into it, according to its product page:
- Risk calculator: size positions for stocks, forex, crypto, futures and CFDs from your risk and stop, with the risk-to-reward ratio shown as you plan.
- Pre-trade checklist: an editable list you go through before entering. You could add a line such as "Fear & Greed reading noted, and position size still within my rules".
- Discipline guardrails: a daily loss limit and a post-loss cooldown.
- Trading journal: log trades with before, during and after screenshots, tags, emotions and notes, and filter the journal by tag. A tag like "extreme-fear" makes it easy to pull those trades up later.
Your data is stored locally on your device. Pro removes the journal cap and adds advanced analytics; see TradeDesk pricing.
TradeDesk is a planning and journaling tool, not financial advice. Trading involves risk of loss.
FAQ
What does a Fear & Greed reading of 10 mean?
It means Bitcoin's recent volatility and drawdowns are much higher than usual and buying momentum and interest have dried up, compared with the last 30 to 90 days. Alternative.me classes anything that low as Extreme Fear.
Is extreme fear a good time to buy crypto?
Sometimes it has been, sometimes not. Past readings of 10 were followed by gains and by further losses, and the median three-month result is close to flat in the studies above. It shouldn't be the only reason for a trade.
How often is the index updated?
Once a day. Alternative.me shows the current value, yesterday's, last week's and last month's, and offers a free API with the full history.
Does the index cover altcoins?
The current index is for Bitcoin only, according to Alternative.me, although it's widely used as a gauge for the wider crypto market.